 Type to Token Visualizer
Hide information
INTRODUCTION
“What does this tool visualize?”
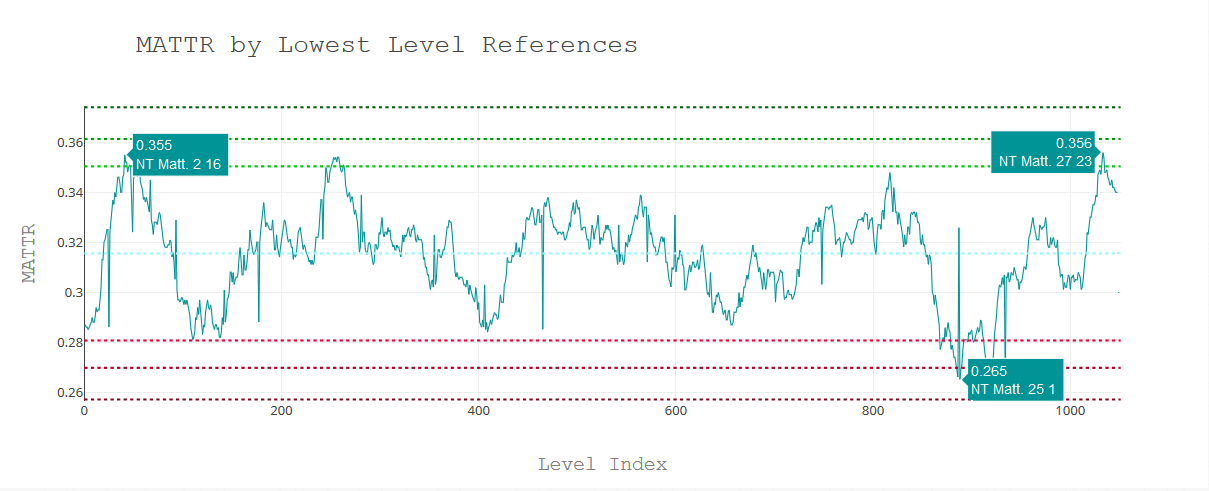
This tool visualizes the changes of moving average type-to-token ratio (MATTR) over the length of a text. While researchers are usually interested in getting a single MATTR value for a text, this tool can show each individual value throughout a text. The image below, for example, shows all the MATTR values of the beginning of each verse within the Gospel of Matthew.
EXCEL
“Can't I just use Excel to do this?”
Yes you can, but Excel is limited to one million rows, so if you are analyzing a big text, it will cut off your data after the millionth row. Excel also doesn't have the interactive tools to hover, zoom, and pan like we have here.
WORDCRUNCHER BOOKS
“How can I visualize MATTR for books already within WordCruncher?”
You can get it from the Phrase Compare report after calculating the n-grams of a text. To get the TTR data:
- Run the Phrase Compare report on a book.
- Click on the Save results dropdown menu at the bottom.
- Select Type-to-Token Ratio files and then select the segments or levels report.
- Provide a file name and click Save.
- If you select the levels report, you’ll get a message on whether you want the summary report or the full report. For this visualization tool to work, select the complete report.
YOUR BOOKS
“How can I visualize MATTR for my own texts?”
You will need to put your texts into WordCruncher first:
- Apply for and install the Publishing Toolkit.
- Depending on your file format, open the WordCruncher Indexer program to convert your files. See the Indexer page for details on file conversion.
- Open the text in WordCruncher.
- Use the same steps from the previous section to get the TTR data.
LEVELS AND SEGMENTS
“Should I output the levels or segments report?”
Either one will work. The levels report will process faster than the segments report because the segments report is a file with every word in a text. However, you can make this run faster when an initial prompt asks you if you want to analyze every Xᵗʰ word rather than every word.
When you click on a data point in the segments report, it will take you to the exact word in question, while clicking on a data point in the levels report will only take you to the beginning of the reference level.
FILE FORMATS
“Should I output a TXT or CSV file?”
Either one will work. TXT files are smaller, so you will get your charts faster if you save it as a TXT file.
SIGNIFICANT THRESHOLDS
“What do all of the dashed horizontal lines mean?”
These lines indicate points of significant thresholds:
- The light blue line indicates the average MATTR throughout the whole text.
- The green lines indicate the 3 levels of statistical significance (Z-Score = 1.96, 2.576, and 3.291), indicating a high MATTR.
- The red lines indicate the 3 levels of statistical significance (Z-Score = 1.96, 2.576, and 3.291), indicating a low MATTR.
HYPERLINKS
“Is there any way to easily reference back to the text in WordCruncher?”
Absolutely. As of Build 103, you can click on any data point and you will be sent to WordCruncher with the text opened to the location you clicked. The first word within the window will be highlighted gray.
ERROR HANDLING
“What should I do if there are errors?”
If you do not see a visualization below after adding a file, it is either because you are using an antiquated browser (Internet Explorer), or there is a problem that I have not tested yet. Contact me as soon as possible at wordcruncher@byu.edu, and attach the file you are trying to visualize.
